[Home] [Up]
WABAMUN
LAKE LEVEL CHARTS - There
are endless discussions about the level of the water in Wabamun Lake. Sort of
similar to weather, politics & religion! Gawd we sailors love to talk. But
then, water depth is of the utmost importance at a launching ramp or marina, especially for a sailboat equipped with a fixed keel. The concern
is valid when you consider that the only water flowing into the lake is
spring run off, a few tiny creeks, a some artesian wells and topped off by
summer rains. These few inflows
have a tough time offsetting the winter evaporation when the temperature
differential is the greatest.
In mid 2001 Trans-Alta added
 an artificial inflow by pumping water into Wabamun Lake via the channel at the
Sundance Power plant. The pumping capacity was doubled in 2002. The water in the
channel is almost crystal clear which is quite a phenomena considering that we
sail on dark water most of the time and can't see the bottom. This is a great place to check
the hull
if you have snorkel gear.
an artificial inflow by pumping water into Wabamun Lake via the channel at the
Sundance Power plant. The pumping capacity was doubled in 2002. The water in the
channel is almost crystal clear which is quite a phenomena considering that we
sail on dark water most of the time and can't see the bottom. This is a great place to check
the hull
if you have snorkel gear.
The only natural drainage from the lake
flows out the creek through the Paul Band golf course. This creek has a man made weir that effectively limits the
lake's maximum water elevation. The lake seldom overflows the weir.
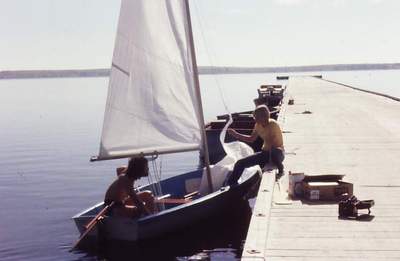
Just for interest, the photo at right shows me at the Wabamun town dock on my Kolibri. Notice how easily Kerry
can step into the dinghy from the dock! The picture was taken in 1976 and my guess is the
water was flowing over the weir quite nicely given the fact that it was about a meter
above the weir. In reality the lake was at an all time high, held back by a
few beaver
dams. Needless to say there are lots of opinions and even some
facts about Wabamun Lake but evidence like this helps to end those campfire disputes! By
the way, I suggest you stay away from the end of this pier. Take note of
the concrete ice breaker shown at the end of the pier. It no longer exists but I doubt that the underwater supports were
removed!
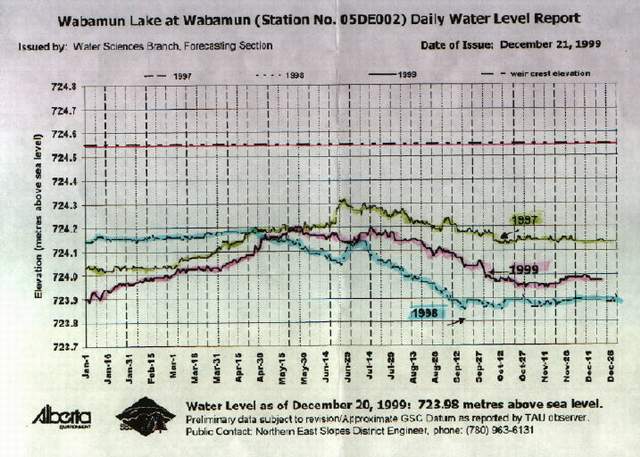
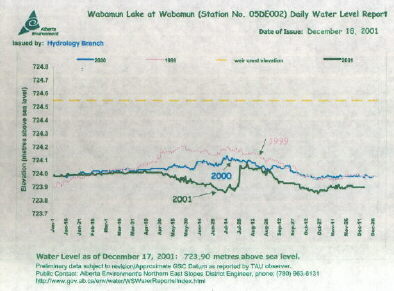
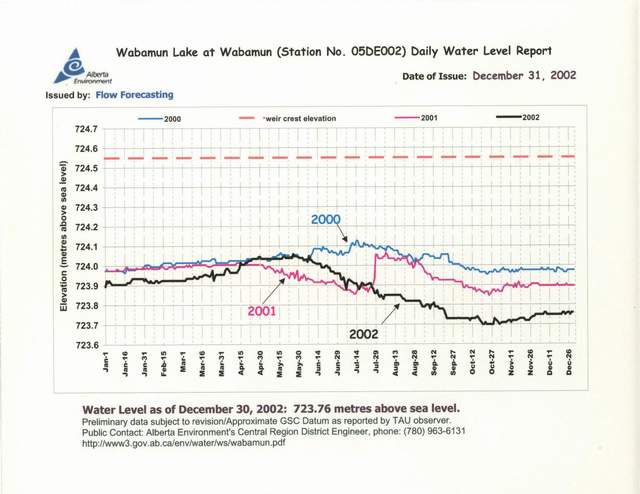
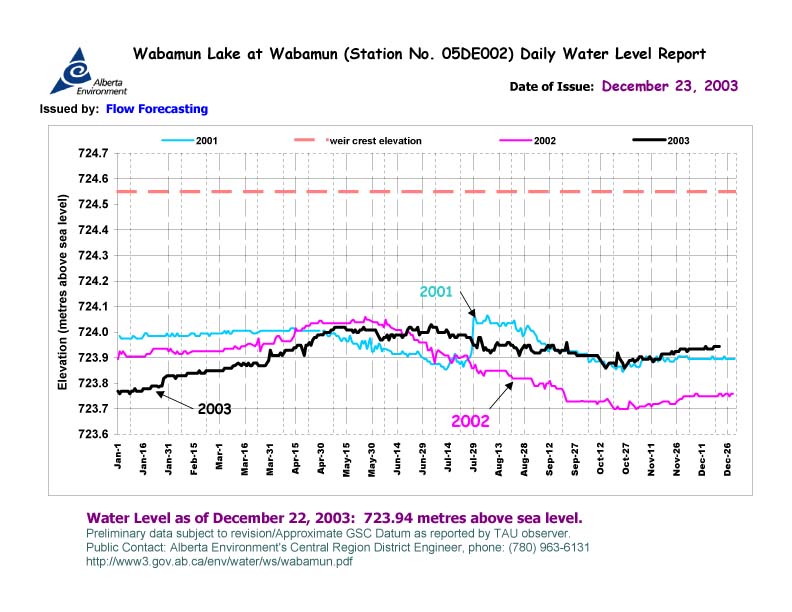
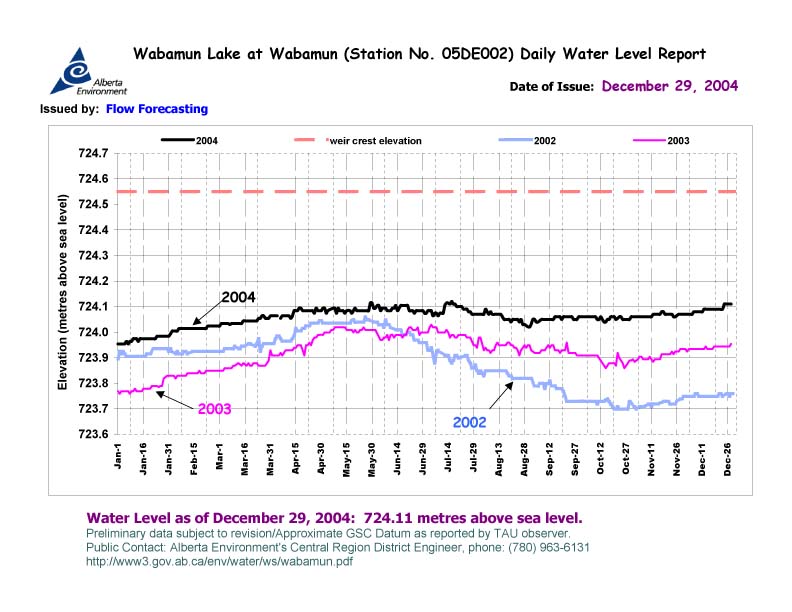
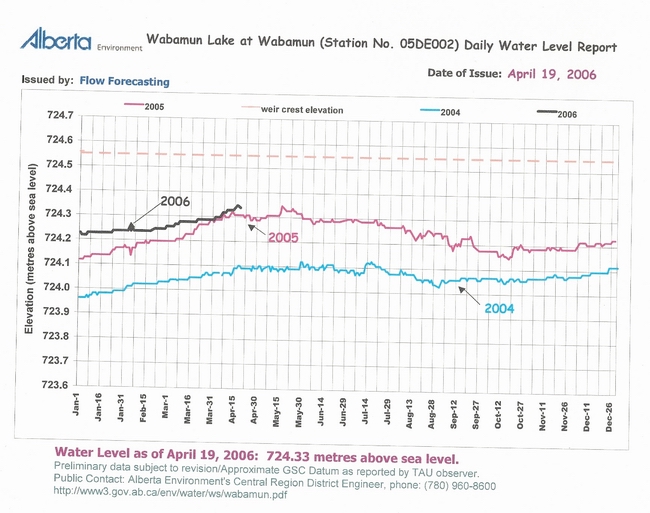
THREE YEAR LAKE CHARTS
- Alberta Environment monitors the water level at Wabamun Lake and their
three year charts help to set some
"opinions" straight. To
understand a long trend
you must assess the data in several charts. A
good point of reference is the height of the weir which is shown as a brown dotted
line (724.55M) on each chart. For fresh waters, the lake elevation (level) is shown in meters
above sea level. Shown below are
several older year
end charts and the current chart.
PS: If
I were to bet on when the ice is off the lake, I would pick April
21!
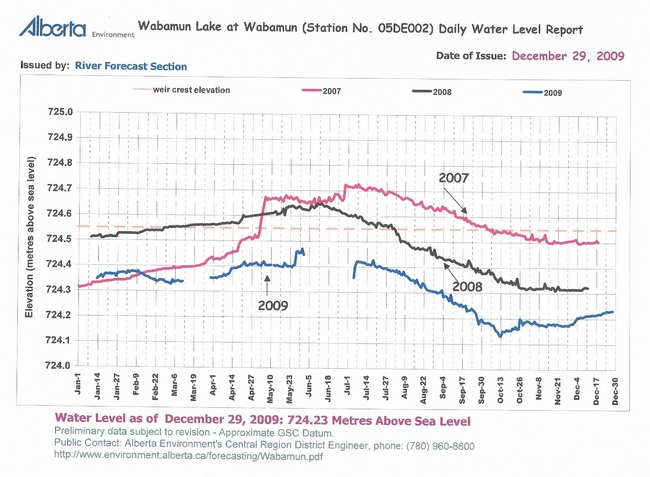
NOTE -
The River Forecast Section of
Alberta Environment no longer produces the Wabamun Lake Level chart shown above. It was created in the mid to late nineties as a result of
public concern over water levels of the lake. The report was discontinued for several reasons:
-
the
relatively low number of stakeholders requesting the report.
-
the labour-intensive
process to produce the original report.
-
AENV River Forecast Section
now produces a different type of report
that shows more detailed lake level plots.
The current lake level plots on the AENV web site display the lake level for this
year, historical average (from 1969-99), and historical quartiles (cutting off
the lower and higher 25% of data). These reports are the new standard for
reporting and are considered more rigorous and informative over relevant
time scales. The original Wabamun Lake Report did not display any quartiles, but
did display the previous two years of data and the elevation of the weir (724.55
m) above sea level.
UofA ENVIRONMENTAL RESEARCH and
STUDIES CENTRE - The ERSC acts as a coordination and information agency for the extensive environmental research and studies programs at the University of Alberta.
Visit their web site to learn more.